Saturday, April 27, 2013

Unit 5/6


From short run to long run

»»AS curve doesn't shift in response to changes in the AD curve in the short run
    I.e. -nominal wages doesn't respond to price level wages
          - workers may not realize impact of the changes on may be under contract
»» long run - period in which nominal wages are fully responsive to previous changes in price level

-when changes occur in the short run they result in either increased our decreased producer profits -not changes in wages paid
-in the long run increases in AD result in a higher price level, as in the short run, but as workers demand more money the AS curve shifts left to equate production at the original output level, but now at a higher price
- in the long run, the AS curve is vertical at the natural rate of unemployment (NRU), or full employment (FE) level of output. Everyone who wants a job has one and no one is enticed then into or out of the market.
- demand - pull inflation will result when an increase in demand shifts the AD curve to the right temporarily increasing output while raising prices
- cost-push inflation results when an increase in input costs that shifts the AS curve to the left. In this case the price level increase is not in response to the increase in AD, but instead the cause of price level increasing


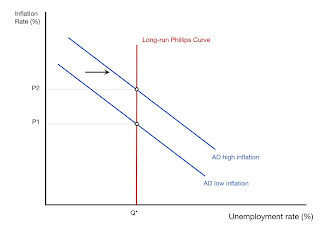
»»  the Phillips curve

Represents the relationship between unemployment and inflation
The trade off between inflation and unemployment only occurs in the short run
Each point on the Phillips curve corresponds to a different level of output

»Long run Phillips curve (LRPC)

-It occurs at the natural rate of unemployment
-It is represented by a vertical line
-There is no trade off between unemployment and inflation in the long run
    -The economy produces at the full employment output level
    -The nominal wages of workers fully incorporate any changes in price level as wages adjust to inflation over the long run
-LRPC will only shift if LRAS curve shifts
Because of the long run Philips curve exists at the natural rate of unemployment (NRU), structural changes in the economy that effects UN structural changes in the economy that effects UN will also cause the LRPC to shifts
      -increase UN shift LRPC >
      -decrease UN shift LRPC <

-The three of unemployment that make up LRPC
Frictional
Structural
Seasonal

» the short run Philips curve (SRPC)

-Phillips is assumed to be stable in the short run because the SRAS curve is stable
-If there is an increase our decrease in AD you shift up or down along the SRPC
- if SRAS increases it will shift to the right, but the SRPC with shift to the left
- if SRAS decreases it will shift to the left, but the SRPC will shift to the right

»» supply shocks 

-rapid and significant increase in resource cost which causes the SRAS curve to shift this producing a corresponding shift in the short run PC curve

»» misery index

-a combination of inflation and unemployment in any given year
-single digit mystery is good

» stagflation occurs when high unemployment and high inflation happens at same

»disinflation when inflation decrease over time

» supply- side economics or reagonomics

-support policies that promote GDP growth by arguing that high marginal tax rates along with current system of transfer payments price discentives to work, invest, innovate, and underage entrepreneurial ventures
- the supply side economist tend to believe that the AS curve shifts to the right thus creating the trickle down effect

»» meaningful tax rates

-amount proof on the last dollar earned it on each additional dollar earned
-by reducing marginal tax rates supply sides believe that you would encourage more people to work longer foregoing leisure time for extra income


»»laffer curve

-Trade offs between tax rates and tax revenues
- 3 criticism
    -where the economy is actually located in the curve is difficult to determine
    -tax cuts also increase demand which can fuel inflation
    - empirical evidence suggest they impact of tax rates on incentives to work, invest, and save are small


>>Economic Growth and Productivity 

  • Economic Growth Defined
    • Sustained increase in Real GDP over time
    • Sustained increase inReal GDP per Capita over time
  • Why Grow?
    • Growth leads to greater prosperity for society
    • Lessens the burden of scarcity
    • increases the general level of well-being
  • Conditions of Growth
    • Rule of Law
    • Sound legal and Economic Institutions
    • Economic Freedom
    • Respect for Private Property
    • Political and Economic Stability
      • Low inflationary Expectations
    • Willingness to sacrifice current consumption in order to grow
    • Saving 
    • Trade
  • Physical Capital
    • Tools, machinery, factories, infrastructure
    • Physical Capital is the product of investment
    • Investment is sensitive to interest rates and expected rates of return
    • It takes capital to make capital
    • capital must be maintained
  • Technology and productivity
    • Research and development, innovation and invention yield increases in available technology
    • More technology in the hands of workers increase productivity
    • Productivity is output per worker
    • More Productivity = economic growth
  • Human Capital
    • People are a country'e most important resource. Therefore human capital must be developed
    • Education
    • economic freedom 
    • the right to acquire private property
    • incentives
    • clean water
    • stable food supply
    • access to technology
  • Hindrances to Growth
    • Economic and political instability 
      • High inflationary expectations
    • Absence of the rule of law
    • Diminished private property rights
    • negative incentives
      • the welfare state
    • Lack of savings
    • excess current consumption
    • Failure to maintain existing capital
    • Crowding out of investment
      • government deficits and debt increasing long term interest rates
    • Increased income inequality and populist policies
    • Restrictions onFree international Trade


Thursday, April 11, 2013

Unit 4


Color Coordination

Money
Federal Reserve Bank
Balance sheet
Fiscal Policy
Loanable funds


1. Uses of money
-As a medium of exchange, trading
-Unit of account, establishes economic worth (P » worth (quality))
-Store of value, money holds value over a period of time

2. Types of money
-Commodity money, goods: chicken, beans, shoes. 
     It gets its value from the type of material from which it is made.
-Representative money: IOU, paper money that is backed by something tangible
- fiat money: it is money because the government says so
*America uses fiat money

3. Characteristics of money
- Durability
- portability
- divisibility
- uniformity
- scarcity
- acceptability

4. Money supply
- M1 money; consists of currency in circulation. 
     »Currency is coins and paper money. 
     »Checkable deposits (demand deposits) or checks.
     » traveler's checks
- M2 money; consists of M1 money plus 
     »savings accounts
     »money market accounts
     »deposits held by banks outside the US


»»Fractional reserve banking: it is the process by banks of holding a small portion of their deposits in reserve and loaning out the excess
1. Banks keep cash on hand (required reserves) to meet depositor's need
2. Banks must keep reserved deposits in their vaults or at the federal reserve bank
3. Total reserves, total funds held by a bank,
    *TR = (required reserves) RR + ER (excess reserves, reserves beyond those that are required )
4. Banks can legally lend only to the extent of their excess reserves
5. Reserve ratio = required reserves divided by total reserves.  *RR / TR
     ***typical required reserve ratio = 10%, set by the Fed

»»Significance of a fractional reserve system
1. 
2. Required reserves do not prevent bank pennants because banks must keep their required reserves (fdisd)
3. Reserve requirements gives the Fed control over how much money banks can create


»»Functions of the Fed (federal reserve bank)
1. To control the money supply through monetary policy (circulation of currency and adjusting the interest rate)
2. Issue paper money
3. Serve as a clearing house for checks
4. Regulate banking activities
5. Serve as a bank for banks

»»»Balance sheet:
A statement of assets and claims summarizing the financial position of a firm or a bank at some point in time
 *A balance sheet must balance at all times
»»Assets vs liabilities
»Assets:
     -What you own
     -Reserves:
          - required reserves (RR) - % required by Fed to keep on hand to meet demand
          - excess reserves (ER) - % reserve over and above the amount needed to satisfy the minimum reserve ratio set by Fed
     -Loans and firms, consumers, and other banks (earns interest)
     -Loans to government = treasury securities
     -Bank property - (if bank fails, you could liquidate the building / property)

»Liabilities + owner's equity or network:
     -What you owe
     -Claims of non owners
     -Demand deposits ($ put into bank)
     -Times deposits (CDs)
     -Loan firms: federal reserve and other banks
     -Shareholders equity - (to set up a bank, you must invest your own money in it to have a stake in the banks success or failure)

100% reserve banking have no impact on size of money supply

In a fractional-reserve bank system, banks create money


»»  the required reserve ratio
-The % of demand deposits that must be sure as vault cash or kept on reserve as federal funds in the bank's account with the federal reserve.
-The required reserve ratio determines the money multiplier (1/reserve ratio )
     -decreasing the reserve ratio increased the rate of money creation in the banking system and is expansionary
     -increasing the reserve ratio decreases the rate of money creation in the banking system and is Contractionary
-Changing the required reserve ratio is the least used tool of monetary policy and is usually held constant at 10%

»»The monetary (money) multiplier
-The money multiplier shows us the impact of s change in demand deposits on land and eventually the money supply
-The money multiplier indicates the total number of dollars created in the banking system by each 1$ addition to the monetary base (bank reserves & currency in circulation)
-To calculate the money multiplier, divide 1 by the required reserve ratio
     Money multiplier = 1/reserve ratio
          EX: if the reserve ratio is 25%, then the multiplier = 4

»»The four types of multiple deposit expansion question
-Type 1: calculate the initial change in excess reserves
     Aka the amount a single bank can loan from the initial deposit
-Type 2: calculate the change in loans in the banking system
-Type 3: calculate the change in the money supply
*sometimes type 2 and type 3 will have the same result (ie no federal involvement)
-Type 4: calculate the change in demand deposits 


»»Fiscal policy
-Controlled by congress
     1. Tax or
     2. Spend
»»Monetary policy
-Controlled by Fed reserve bank
     1. OMO (open market operation - feds can buy or sell bonds/securities) a referred monetary tool because it's flexible
     2. Reserve requirement
     3. Discount rate; it is the interest rate charged by the Fed for over night loans to commercial banks *it doesn't change money supply directly
     4. Federal fund rate; it is the interest rate charged by one commercial bank for overnight loans to another commercial bank

»»»The Fed has several tools to manage the money supply by manipulating the excess reserves held by banks, a practice known as monetary policy
»»The federal tools of $ policy
» expansionary (easy $) - wants to increase money supply
- monetary policy options;
    -open market operation (OMO): buy back bonds from the public
     -Required reserves: decrease reserve ratio
     - discount rate: decrease discount rate
     - Federal funds rate: decrease federal fund rate
»» Contractionary (tight $) - wants to retract money supply
     -OMO: sell bonds to the public
     -RR: increase reserve ratio
     - discount rate: increase discount rate
     -Federal funds rate: increase federal fund rate

»» money creation process
- $ multiplier = 1/RR
- multiple deposit expansion
- Banks create money by making loans
EX: RR = 20%, loan = $500, Q: total money created
1/.2 = 5 x loan, 500 = 2500 money created « potential loans
**assumption: no excess reserves

»»Loanable funds market
- the market whee savers and borrowers exchange funds (Qlf) at the real rate of interest (r%)
- the demand for loanable funds, or borrowing comes from households, firms, government and foreign sector. The demand for loanable funds is in fact the supply of bonds
- the supply of loanable funds, or saving comes from households, firms, government and foreign sector. The supply of loanable funds is also the demand for bonds.

»Changes in the demand for loanable funds
-demand for loanable funds= borrowing (I.e. supplying bonds)
- more borrowing = more demand for loanable funds »
-less borrowing= less demand for loanable funds «
EX: -government deficit spending= more borrowing= more demand for loanable funds therefore DLF » and r%^
- less investment demand= less borrowing= less demand for loadable funds therefore DLF « and r% v

»Changes in supply for loanable funds
-supply of loanable funds= saving (I.e. demand for bonds)
- more saving = more supply in loanable funds »
- less saving= less supply in loanable funds «
EX: -government budget surplus = more saving= more supply of loanable funds therefore SLF » and r%  v
-decrease in consumer's MPS = less saving= less supply of loanable funds therefore SLF « and r%^


Review:

-Required reserves = amount of deposit X required reserve ratio
-Excess reserves = total reserves - required reserve
-Maximum amount in a single bank can loan= the change in excess reserves caused by a deposit
-The money multiplier = 1/required reserve ratio
-Total change in loans = amount single bank can lend X money multiplier
-Total change in the money supply= total change in loans + $ amount of Fed action
-Total change in demand deposit = total change in loans + any cash deposited